Martin Enserink has just published the third instalment in an ongoing story of strange results and possible → likely → confirmed misconduct in the field of marine biology, and more specifically the purported effects of climate change on the behaviour of fish. The first two instalments are here (2020) and here (2021).
After Martin's 2021 article, I wrote this blog post describing a few analyses that I had contributed to this investigation. Today I want to look at a recently-corrected article from the same lab, mentioned by Martin in his latest piece (see the section entitled "A corrected paper"), and in particular at the data file that was released as part of the correction, as I think that it illustrates an interesting point about the forensic investigation of data.
Here is the article:
Here are the two main issues that I see with this (claimed) dataset.
This isn't what a dataset looks like
As I noted in my earlier post, this just isn't what a dataset looks like. You don't collect data in multiple 2-D panels and lay those out in a further 2-D arrangement of 18 x 5 panels, because that's just making life difficult for yourself when you come to do the analyses. If for some reason you actually collected your data like that, you would need to write some quite sophisticated software—probably a couple of hundred lines of Python or R code—to reliably read the data in a form that is ready to generate the figures and/or tables that you would need for your article. That code would have to be able to cope with the inevitable errors that sneak into files when you are collecting data, such as occasional offsets, or a different number of fish in each chunk (the chunks on lines 78 through 94 only have 17 fish rather than 20; incidentally, the article says that each experiment was run on 18 to 20 fish), or an impossible value such as we see at cell DU46. (The code that I wrote to read the dataset from the Dixson et al. article that was the subject of my earlier blog post is around 300 lines long, including reasonable spacing.)
So there would seem to be two possibilities. Either the authors have some code that reads this file and reliably extracts the data in a form suitable for running the analyses; or, they have another data file which is more suited to reading directly into SPSS or R without having to strip away all of the formatting that makes the Excel sheet relatively visually appealing. Either way, they can surely provide one or other of those to us so that we can see how they dealt with the problems that I listed above. (I will leave it up to the reader to decide if there are any other possibilities.)
There is too little variation... in the unremarkable results
In my earlier blog post on this topic I analysed another dataset from the same lab (Dixson et al., 2014) in which there were numerous duplications, whereby the sequence of the numbers of choices of one or other flume for the 20 fish in one experiment were often very similar to those in another experiment, when there was no reason for that to be the case.
In the current dataset there are a few sets of repeated numbers of this kind (see image), but I don't think that they are necessarily a problem by themselves, for a couple of reasons.
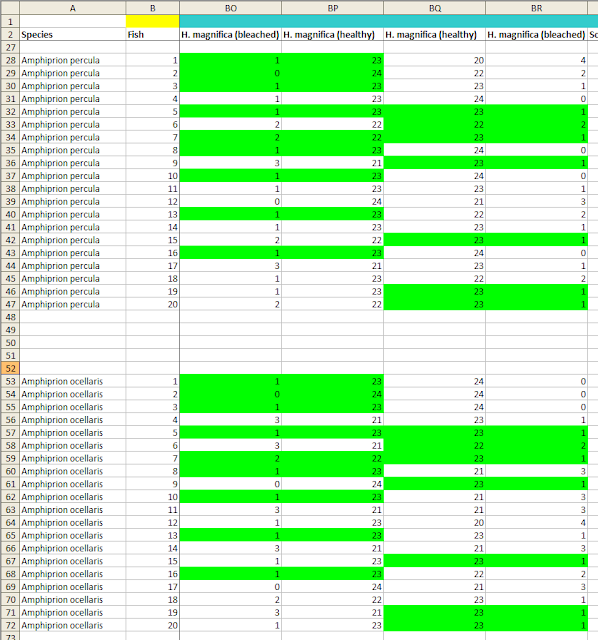
First, these lines only represent sequences of a few identical numbers at a time, whereas in the 2014 dataset there were often entire duplicated groups of 20 fish.
Second, for most of these duplications, the range of the numbers is severely restricted because they (at least ostensibly) correspond to a large experimental effect. The Scott and Dixson article reports that in many cases, the fish chose flume A over flume B almost all of the time. The means that the numbers of observations of each fish in flume A, out of 24 opportunities, must almost always be 22 or 23 or 24, in order for the means to correspond to the figures in the article. There are only so many ways that such a small number of different predicted values can be distributed, and given that the person examining the dataset is free to look for matches across 180 20-fish (or 17-fish) columns of data, a number of duplicates of a certain length will very likely arise by chance.
However, the dataset also contains a number of cases where the fish appeared to have no preference between the two. The mean number of times out of 24 trials that they were recorded as having chosen flume A (or flume B) in these cases was close to 12. And it turns out that in almost all of these cases, there is a different lack of variation, not in the sequence of the observations (i.e., the numbers observed from top to bottom of the 20 fish across experiments), but in the variability of the numbers within each group of fish.
If the fish genuinely don't have a preference between the two flumes, then each observation of a fish is basically a Bernoulli trial with a probability of success equal to 0.5—which is a fancy way of saying "a coin toss"—and so the 24 trials for each fish represent 24 coin tosses. Now, when you toss a coin 24 times, the most likely result is 12 heads and 12 tails, corresponding to the fish being in flume A and B 12 times each. However, although this result is the most likely, it's not especially likely; in fact, the exact 12–12 split will only occur about 16% of the time, as you can see at this site (put 24 into "Number of Bernoulli trials", click Calculate, and the probability of each result will be in the table under the figure with the curve). If you repeat those 24 trials 100 times, you would expect to get 8 As and 16 Bs (or 8 Bs and 16 As) either 4 or 5 times.
Now let's look at the dataset. I identified 32 columns of data with 20 (or, in a few cases, 17) fish and a mean of around 12. I also included 3 other columns which had one or more values of 12; as I hope will become clear, this inclusion works in the authors' favour. I then calculated the standard deviation (SD) of the 20 (or 17) scores that are composed of 24 trials for each of these 35 columns of data.
Next, I generated one million random samples of 24 trials for 20 simulated fish and calculated the SD of each sample. For each of the 35 SDs taken from the dataset, I calculated the fraction of those million simulated SDs that were smaller than the dataset value. In other words, I calculated how likely it was that one would observe an SD as small as the one that appears in the dataset if the values in the dataset were indeed taken from 24 trials of 20 fish that had no preference between the flumes. Statistically-minded readers may recognise this as the p value for the null hypothesis that these data arose as the result of a natural process, as described by the authors of the Scott and Dixson paper.
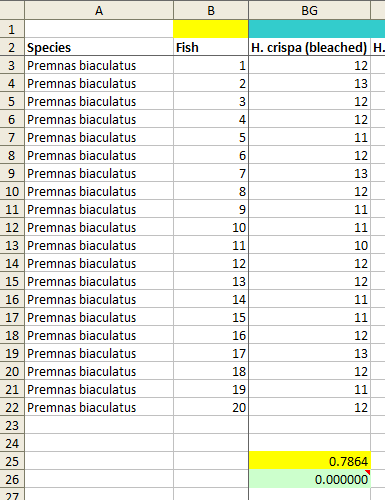
The results are not very good for the authors. For only nine of the samples, including the three that contain a small number of scores of 12 but otherwise have a substantially different mean, the p values are greater than 0.05. Seven of the p values are zero, meaning that an SD as low as the one corresponding to the data reported by the authors did not occur at all in one million simulated samples (see image below for an example). A further six p values are less than 0.0001 and four are less than 0.001. The overall chances of obtaining these results from a natural process are hard to calculate accurately (for example, one would need to make a small adjustment for the fact that the results come in pairs of 20-fish samples, as each fish took part in 2 sets of 24 trials and those two sets are not independent), but in any case I think it can safely be described as homeopathic, if only from the seven cases of zero matches out of one million.
Conclusion
Lack of expected variability is a recurring theme in the investigation of bad science. Uri Simonsohn was one of the pioneers of this in his paper "Just Post It", and more recently Kyle Sheldrick came up with a novel method of checking whether the sequence of values in a dataset is "too regular". I hope that my explanation of the issues that I see in the Scott and Dixson dataset is clear.
Martin Enserink's latest piece mentions that the University of Delaware is seeking the retraction of three papers with Danielle Dixson as an author. Apparently the Scott and Dixson (2016) article—which, remember, has already been corrected once—is among those three papers. If nobody identifies a catastrophic error in my analyses then I plan to write to the editors of the journal to bring this issue to their attention.
Data availability
I have made an annotated copy of the article PDF file available here, which I think constitutes fair use. As mentioned earlier, the dataset is available here.

I cannot wait to reuse 'homeopathic' in my next stats-based argument. A thousand thanks.
ReplyDeleteOne question about this: did you select rows that had a mean of about 12, or did you select fish species where the authors said there was no treatment effect? In the former case we clearly shouldn’t expect much variation in the number of times the fish picks each option—we’ve selected to some extent on the outcome variable not varying much. In the latter case, it’s less clear: we wouldn’t necessarily expect totally random variation, since “there’s no treatment effect” implicitly throws out fish with p<0.05.
ReplyDeleteThis doesn’t affect the spirit of your critique but it does what we would expect the variation in the outcome to look like.
I didn't approach this very scientifically, because I had no intention of calculating an exact overall probability, and I knew that there were limitations with, for example, some lack of independence in the two runs of each fish (corresponding to the paired columns of data). At first I chose all the "chunks" that appeared to have a mean of around 12; although I calculated their SD I didn't calculate their mean, but that seemed OK as I hadn't specified a threshold (e.g., would 13.3 count?). I then thought that I could give the authors the benefit of the doubt by including any chunk where even one fish scored 12 (i.e., 50-50 for each flume), which of course is a bit silly since 12 isn't all that different from 13. So I'm not sure that my method is especially valid, but when seven of the results give less than 1 in a million chance, and five of those are totally independent, you don't need to do the full formal analysis, I think.
DeleteThis comment has been removed by a blog administrator.
ReplyDelete