29 January 2017

On [the] edge

This post is mainly addressed to all of my online friends, acquaintainces, contacts, etc etc.  Whether we interact via Twitter, Facebook, Skype, e-mail, or some combination of these.  (Everyone says I have to be on WhatsApp and Instagram too, but I already waste way too much time online as it is.)  Of course, people I've never heard of are welcome to read and comment on this too.

These are strange times.  Since about 24 June 2016 I have had this constant strange feeling of unease.  It's faint, but real.  And since 9 November 2016, it has become a bit less faint.

I don't think I've ever had any problems with mental health.  That is, if I complete a measure of depression, I don't think I've never been at a point in my life where I scored above 0 on any of the items, and even then I only would have scored 1 on a couple.  About once every three years I go through a little phase where I feel strangely lethargic for a couple of days (after controlling for hangovers), but that's about it.

I just looked at the Beck Depression Inventory and today I scored 6 out of 63.  Probably my highest ever, but I didn't score more than 1 on any item, and a score of 1 to 10 is classed as "These ups and downs are considered normal".  So apparently I'm fine at that level.  This sums up more like how I feel:
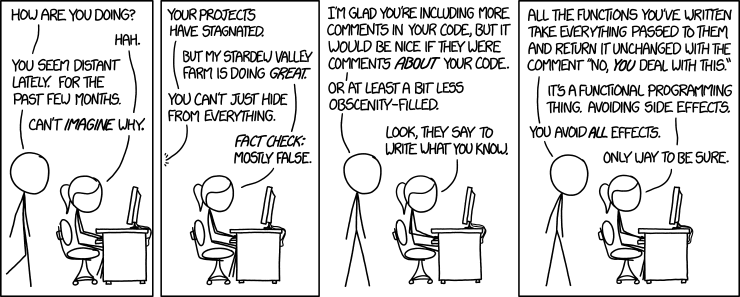


My "work", such as it is (I don't have a job that involves leaving the house and going to an office with a boss where I have to do stupid shit), involves quite a lot of being critical of other people's work.  I try to do this in as civilised a way as possible.  I prefer to write my critiques of scholarly work in the form of manuscripts that are at least intended for publication in journals (except when something really pisses me off and I dash off a blog post about it, which I usually regret shortly afterwards when it turns out I didn't do my due diligence).  When you work this way, you need a valve to release the pressure, because it's very, very slow and tedious to work your way through a series of articles about how people consume pizza with almost innumerable statistical errors in them (shameless pimping of our new preprint there).  For me, that valve is mostly Twitter, and sometimes Facebook.  But that brings me back face to face with... well, the causes of "that feeling".  80% of the tweets in my feed, every second Facebook post seems to be about what the whole world (or at least, my blinkered, woolly-liberal(*) section of it) is talking about.

I'm starting to think that this feeling of unease may be affecting my interactions.  People who used to be up for stupid, nerdy banter about stuff that doesn't matter seem to be a little bit more sensitive.  Stuff doesn't get discussed that probably ought to.  Or, perhaps worse, stuff that shouldn't be discussed does come up.  I've witnessed people whose fundamental views on a particular question differ by about one hair's width from each other having fights --- well, not quite fights, but exchanges of snarkiness --- over utterly trivial details.  People seem to be a little bit on edge.  I find myself wondering if I ought to drop that bit of banter into a tweet when the only people who will read it are people I've been happily bantering with for a couple of years.

I have been wondering whether I'm alone in experiencing this "gnawing feeling" in the form of (what I presume is) low-level stress.  Today, as I wondered whether to publish this draft (which I've been working on occasionally for a few days now, not that it shows from the quality of the writing), I saw that my occasional co-conspirator James Heathers --- for whom the words "irrepressibly upbeat" are normally a mere pastiche of an understatement --- seems to have been having something similar going on.  So maybe it's not just me.

And I'm lucky.  I'm white and male and all of the other things that place me above the midpoint of luck and privilege on every scale ever.  Just after the US election result, I saw a tweet from a Black person that basically said, "Hey, liberal white folks. That feeling in your stomach right now? Welcome to our world, every day of our lives".  So I'm conscious that this is probably just me having a whine about how I don't feel as good as I think I'm entitled to feel.

Currently I don't have many few ideas for cheering myself up.  Silly, over-the-top prog-rock wigouts work a bit, for a few moments.  My slow acquisition of the documents I need to apply for Irish nationality provided a couple of moments of light relief last Friday, as one certificate arrived in the post and I got e-mail confirmation that another was on its way.  But these are small consolations.

Anyway, back to the first paragraph (all the professional writers seem to have learned at writing school that you have to finish with a quirky point that ties back into your first quirky point).  To my online friends, acquaintances, etc: If I am being "differently annoying" right now --- i.e., not in the normal "Nick, we get it, just shut up now" way :-) --- then I apologise, but things are, well, not normal.

PS: Normally I allow comments on my posts, but it doesn't feel right in this case. That seems to fit in with my theme here.  Heh.


(*) I don't think I'm very political.  I mean, yes, I don't like racism, and I think that multinationals probably ought to pay more tax, and the state in some countries should probably help poor people more, but I do find a lot of "progressive" ideas to be just sloganising.  I think that there are real biological differences between the sexes, and I don't think want it to be impossible to start a business because you might make a lot of money from it.  I just wish the view was better from on top of this pile of fences.

14 January 2017

In which science actually self-corrects, for once

Amid all the stories of bad behaviour by researchers confronted with demonstrations of errors and other problems with their work --- I'm sure many readers have their own favourite examples of this --- I thought I'd start the year off with a story of somebody doing the right thing.

You may be familiar with our (that's James Heathers and me) GRIM article, in which we demonstrated a technique for detecting certain kinds of reporting errors in journal articles, and showed that there are a lot of errors out there.  The preprint was even picked up by The Economist.  GRIM has caused a very small stir in skeptical science circles (although nothing compared to Michèle Nuijten's statcheck and Chris Hartgerink's subsequent bulk deployment of it with reporting on PubPeer, a project that has been immortalised under the name of PubCrawler).  Some people have started using the GRIM technique to check on manuscripts that they are reviewing, or to look at older published articles.  Even the classic 1959 empirical demonstration of cognitive dissonance by Festinger and Carlsmith succumbed.

Round about the time that we were finalising the GRIM article for publication, I came across Mueller and Dweck's 1998 article [PDF] in JPSP, entitled "Praise For Intelligence Can Undermine Children's Motivation and Performance".  I'm quite skeptical of the whole "mindset" area, for a variety of reasons that don't matter here, but I was especially interested in this article because of the tables of results on page 38, where there are no less than 50 means and standard deviations, all with sample sizes small enough to permit GRIM testing.

This looked like a goldmine.  Unlike statcheck, GRIM cannot be automated (given the current state of artificial intelligence), so running one or two checks typically requires reading and understanding the Method section of an article, then extracting the sample sizes and conditions from the description ("Fifty-nine participants were recruited, but three did not complete all measures and were excluded from the analyses" is often what you get instead of "N=56"; if anyone reading this works in an AI lab, I'd be interested to know if you have software that can understand that), and then matching those numbers to the reported means in the Results section.  So the opportunity to GRIM-check 50 numbers for the price of reading one article looked like good value for my time.

So I did the GRIM checks, taking into account that some of the measures reported by Mueller and Dweck had two items which effectively doubles the sample size, and found... 17 inconsistencies in the means, out of 50.  Wow.  I rechecked - still 17.  And a couple of the standard deviations didn't seem to  be possible, either.  (I have some code to do some basic SD consistency checks, but the real expert here is Jordan Anaya aka OmnesRes, who has taken the idea of GRIM and done some smart things with it).

What to do?  I got James to have a look, and he found the same problems as me.  We decided to contact Dr. Carol Dweck, the senior and corresponding author on the article.  Would she want to talk to us? Would she even remember what happened back in 1998?

To our slight surprise (given some other recent experiences we have had... more to come on that, but probably not any time soon), Dr. Dweck wrote back to us within 24 hours, saying that she was going to look into the matter.  And within less than four weeks, we had an answer, in the form of a 16-page PDF document in which Dr. Dweck and her co-author, Dr. Claudia Mueller, had brought Dr. David Yeager to help them.  They had gone through the entire article, line by line, and answered every one of our points.

For several of the inconsistencies that we had raised, there was a conclusive explanation.  In some cases this was due to some degree of unclear or omitted reporting in the article, some of which the reader (me) ought perhaps have caught, others not.  (To our amazement, two of the study datasets were still available after all this time, as they are being used by a teacher at Columbia.)  A few other problems had no obvious explanation and were recorded as probable typos or transcription errors, which is a little unsatisfying but perhaps not unreasonable after 18 years.  And in one other case, outside the table with 17 apparent inconsistencies, I had highlighted a mean that was (rather obviously) not wrong; getting a long sequence of precise measurements right is hard for everybody.

So for once --- actually, perhaps this happens more often than we might think, and the skeptical "literature" also suffers from publication bias? --- the process worked as advertised.  We found some apparent inconsistencies and wrote a polite note to the authors; they investigated and identified all of the problems (and were very gracious about us calling out the non-problems, too).  With Dr. Dweck's consent, I have written this story up as an example of how science can still do things right.  I'm still skeptical about mindset as a construct, but at least I feel confident that the main people researching it are dedicated to doing the most careful reporting of their science that they can.

You can find the full report here (look in Files/Output).

Here's to a collegial, collaborative, self-correcting 2017!

10 January 2017

Academic publishing death match: Double blind review vs. preprints

Double-blind peer review (hereafter, DBPR) has quite a few supporters.  I imagine that people who suspect that their manuscripts have been unfairly treated (say, by a reviewer who is a rival or just doesn't like them personally) are likely to be among this group.  But I've seen other credible arguments that DBPR will level the playing field in science.  Some research suggests that the identity of the author, or even just the prestige of their institution, can affect the likelihood of a manuscript being accepted.  There are also issues about the fair treatment of women and other groups who have been traditionally disadvantaged within science.  If it's all about the quality of the research and not the reputation of the big-name authors, then the science ought to be judged independently of its origin, and since we're only human, eliminating whatever relationship that the reviewers might have with the author looks like it has to be a good thing.

The concept of preprints --- that is, putting a draft of your article somewhere online to get feedback from the community before you submit it for publication in a journal --- also has quite a few supporters.  In the last couple of years we have seen the launch of several new preprint servers for the biological and social sciences, and the open access journal PeerJ has its own preprint section.  I was recently a co-author on a preprint for which it wasn't quite clear where the best journal to submit it would be; this problem went away (give or take the article processing charges, but one of my co-authors had some funding) when an open access journal contacted us and offered to publish it.  (Exactly what conflicts of interest this might create for the peer-review process is left as an exercise for the reader; in view of my general skepticism about OA journals maybe I am being a little hypocritical here, but I will claim that I didn't want to let my co-authors, most of whom are enthusiastic proponents of OA, down here.)

The biggest advantage of preprints is that you can get your research out there quickly.  The GRIM article that I published with James Heathers is a good example of it.  Within a month of us posting the preprint, it had close to a thousand downloads and been featured in The Economist.  Even with a quick review turnaround at Social Psychological and Personality Science (SPPS) --- which might have been expedited by the action editor or reviewers having been exposed to the preprint --- it took five months for this article to be published online.

However, there seems to be a problem when you mix these two good ideas.  The whole point of a preprint is to get people talking about your new ideas, and give you feedback --- presumably in a less formal way than the leaden tone of a decision letter, and the subsequent obsequiousness of your reply ("We thank Reviewer 2 immensely for his extremely helpful comments on section 2.3, although we suspect that they might have been even more extremely helpful if he had read section 2.4 where we anticipated and addressed, with individually-numbered bullet points, every one of these extremely helpful comments").  This is generally going to involve you generating some publicity for your preprint.  Now of course, you could create an egg account on Twitter, and a sock puppet on Facebook ("Danielle Kahnewoman", for example) and a Gmail address for correspondence, and spam the world with links to your anonymised preprint.  But in practice, everyone is going to know who wrote it.  And that means that when the manuscript gets to the reviewers at the journal that offers (or, in some cases, mandates) DBPR, those reviewers won't even have to resort to the standard techniques that they might use to identify the authors (e.g., seeing which author is the most cited in the References section); there is a high chance that they will already have read the preprint.  Even if they haven't, they will just need to put the first sentence of the manuscript inside quotes into Google and they will find the preprint in seconds.

I discovered today that Personality and Social Psychology Bulletin (PSPB) --- a stablemate of SPPS where we published the GRIM article --- is introducing a policy of mandatory DBPR from March 2017.  That's a decision for the Editorial Board, but it makes me wonder what their policy is on preprints.  (Wikipedia has a list of journals and publishers whose preprint policy is known --- generally, it seems, preprints are fairly well accepted --- but the word "psychology" doesn't appear anywhere on that page.)  It seems to me that by mandating DBPR, a journal is essentially committing itself to refusing to consider manuscripts that have previously been posted as preprints, because anonymity is essentially impossible --- or rather, it's untenable to pretend that anonymity is possible --- under such circumstances.

A related problem with mandatory DBPR, if the journal wants to actually attempt to enforce it (in my experience, many problems in any form of professional life start when someone creates a rule and then tries to be consistent in enforcing it, despite the messiness of the world), is that in addition to the assumption that the manuscript is not available through Google, it also assumes, more completely, that it has not previously been seen by the reviewers in an unblinded state.  That seems like a rather untenable assumption, especially in specialised fields.  PSPB is a well-respected journal by any measure, but like any journal ("Cell wouldn't take it? Let's try Nature!") it may not always be the first port of call for the authors who submit there.  Should the reviewer who has already seen the manuscript unblinded on behalf of another journal recuse herself because she knows who the author is, thus depriving the editor of an expert opinion (which, as a bonus, could presumably be provided very quickly)?

For what it's worth, I don't have a solution to this.  I like preprints, but I also like the idea of DBPR (although here are some short counterarguments, and here is some pro-and-con discussion).  I suspect that mandatory DBPR may be incompatible with the realities of the scientific world (even without preprints), because reviewers are human; as mentioned elsewhere in this post, they may have strong suspicions or even outright knowledge of the authors' identities, and it could place them in a morally ambiguous situation to impose a requirement that they declare such suspicions or knowledge.  But I'm loath to criticise this decision by PSPB --- which is by no means the only journal to impose DBPR --- because it was presumably taken for good reasons and after considerable thought.  Short of introducing peer review by AI robots (insert your own joke here about the last terrible review you received), it looks like we're going to be stuck with at least some of the problems associated with scientists being human for a while yet.

[ Update 2017-01-10 15:37 UTC: Thanks to Stepan Bahnik for pointing out that the new, mandatory DBPR policy at PSPB also applies to SPPS and their other stablemate, Personality and Social Psychology Review.  I would be very interested to hear from any members of the Editorial Board of any of those journals about how they see the relationship between that decision and their policy on preprints. ]

27 September 2016

The last word on the well-being and genomics saga (or maybe not)

It looks like the dust may be settling on the long-running saga of the Fredrickson et al. studies of genomics and well-being, and the Brown et al. reanalyses of the same.  We have probably arrived at the end of the discussion in the formal literature.  Both sides (of course) think they have won, but the situation on the ground probably looks like a bit of a mess to the casual observer.

I last blogged about this over two years ago.  Since then, Fredrickson et al. have produced a second article, published in PLoS ONE, partly re-using the data from the first, and claiming to have found "the same results" --- except that their results were also different (read the articles and decide for yourself) --- with a new mathematical model.  We wrote a reply article, which was also published in PLoS ONE.  Dr. Fredrickson wrote a formal comment on our article, and we wrote a less-formal comment on that.

I could sum up all of the above articles and comments here, but that would serve little purpose.  All of the relevant evidence is available at those links, and you can evaluate it for yourself. However, I thought I would take a moment here to write up a so-far unreported aspect of the story, namely how Fredrickson et al. changed the archived version of one of their datasets without telling anybody.

In the original version of the GSE45330 dataset used in Fredrickson et al.'s 2013 PNAS article, a binary categorical variable, which should have contained only 0s and 1s, contained a 4. This, of course, turned it into basically a continuous variable when it was thrown as a "control" into the regressions that were used to analyse the data. We demonstrated that fixing this variable caused the main result of the 2013 PNAS article --- which was "supported" by the fact that the two bars in Figure 2A were of equal height but opposite sign --- to break; one of the bars more than halved in size.(*) For reasons of space, and because it was just a minor point compared to the other deficiencies of Fredrickson et al.'s article, this coding error was not covered in the main text of our 2014 PNAS reply, but it was handled in some detail in the supporting information.

Fredrickson et al. did not acknowledge their coding error at that time. But by the time they re-used these data with a new model in their subsequent PLoS ONE article (as the "Discovery" sample, which was pooled with the "Confirmation" sample to make a third dataset), they had corrected the coding error, and uploaded the corrected version to the GEO repository, causing the previous version to be overwritten without a trace.
This means that if, today, you were to read Fredrickson et al.'s 2013 PNAS article and download the corresponding dataset, you would no longer be able to reproduce their published Figure 2A; you would only be able to generate the "corrected"(*) version.

The new version of the GSE45330 dataset was uploaded on July 15, 2014 --- a month after our PNAS article was accepted, and a month before it was published.  When our article appeared, it was accompanied by a letter from Drs. Fredrickson and Cole (who would certainly have received --- probably on the day that our article was accepted --- a copy of our article and the supporting information, in order to write their reply), claiming that our analysis was full of errors.  Their own coding error, which they must have been aware of because /a/ we had pointed it out, and /b/ they had corrected it a month earlier, was not mentioned.

Further complicating matters is the way in which, early in their 2015 PLoS ONE article, Fredrickson et al. attempted to show continuity between their old and new samples in their Figure 1C.  Specifically, this figure reproduced the incorrect bars from their PNAS article's Figure 2A (i.e., the bars produced without the coding error having been corrected). So
Fredrickson et al. managed to use both the uncorrected and corrected versions of the data in support of their hypotheses, in the same PLoS ONE article.  I would like to imagine that this is unprecedented, although very little surprises me any more.

We did manage to get PLoS ONE to issue a correction for the figure problem.  However, this only shows the final version of the image, not "before" and "after", so here, as a public service, is the original (left) and the corrected version (right).  As seems to be customary, however, the text of Fredrickson et al.'s correction does not accept that this change has any consequences for the substantive conclusions of their research.(*)

Alert readers may have noticed that this correction leaves a problem with Fredrickson et al.'s 2013 PNAS article, which still contains the uncorrected Figure 2A, illustrating the authors' (then) hypotheses that hedonic and eudaimonic well-being had equal and opposite parts to play in determining gene expression in the immune system:
CTRA gene expression varied significantly as a function of eudaimonic and hedonic well-being (Fig. 2A). As expected based on the inverse association of eudaimonic well-being with depressive symptoms, eudaimonic well-being was associated with down-regulated CTRA gene expression (contrast, P = 0.0045). In contrast, CTRA gene expression was significantly up-regulated in association with increasing levels of hedonic well-being (p. 13585)
But as we have seen, the corrected version of the figure shows a considerable difference between the two bars, representing hedonic and eudaimonic well-being, especially if one considers that the bars represent log-transformed numbers.  This implies that the 2013 PNAS article is now severely flawed(*); Figure 2A needs to be replaced, as does the claim about the opposite effects of hedonic and eudaimonic well-being.  We contacted PNAS, asking for a correction to be issued, and were told that they consider the matter closed.  So now, both the corrected and uncorrected figures are in the published literature, and two different and contradictory conclusions about the relative effects of hedonic and eudaimonic well-being on gene expression are available to be cited, depending on which fits the narrative at hand.  Isn't science wonderful?

There seems to be one remaining question, which is exactly how unethical it was for the alterations to the dataset to have been made.  We made a complaint to the Office of Research Integrity, and it went nowhere.  It could be argued, I suppose, that the new version of the data was better than the old one. But we certainly didn't feel that Drs. Fredrickson and Cole had acted in an open and transparent manner.  They read our article and supporting information, saw the coding error that we had found, corrected it without acknowledging us, and then published a letter saying that our analyses were full of errors.  I find this, if I may use a little British understatement for a moment, to be "not entirely collegial".  If this is the norm when critiques of published work are submitted through the peer-review system, as psychologists were recently exhorted to do by a senior figure in the field, perhaps we should not be surprised when some people who discover problems in published articles decide to use less formal methods to comment.


(*) Running through this entire post, of course, is the assumption that the reader has set aside for the moment our demonstration of all of the other flaws in the Fredrickson et al. articles, including the massive overfitting and the lack of theoretical coherency.  Arguably, those flaws make the entire question of the coding error moot, since even the "corrected" version of the figures very likely fails to correspond to any real effect.  But I think it's important to look at this aspect of the story separately from all of the other noise, as an example of how difficult it can be to get even the most obvious errors in the literature corrected.

19 August 2016

It's a small world

I am a co-author on an article that was published (open access!) yesterday (2016-08-18) in the Journal of Social and Political Psychology, along with Stephan Lewandowsky, Michael Mann, and Harris Friedman.  It has an amusing twist to it that illustrates how small the world is.

The idea for this article was floated by Stephan Lewandowsky back in 2013.  He got in touch with Harris Friedman after our article (Brown, Sokal, & Friedman, 2013; full text here) was published, causing some ripples in psychological circles, in American Psychologist.  Steve saw the story of the BSF article as a good example of how people from outside science ought to go about trying to correct problems in the literature, in contrast to the ways in which certain people attack scientists, verbally or even physically, especially when it comes to controversial areas such as research using animals, global warming, genetically-modified organisms, nuclear power, and vaccines.

For various reasons, it took a while to get the drafting process started, but I'm pleased the article has been published now, and not just because it includes Monty Python's The Meaning of Life in the references section.  (I have previously cited This is Spinal Tap; if anyone has any good ideas for ways to cite either Wayne's World or Pulp Fiction, I'm all ears.)

Actually, I didn't know much at all about Michael Mann until I saw his name included in the e-mails at the start of the project.  I was aware that there was something controversial in climate science to do with hockey sticks, but I tend to steer clear of the global warming debate anyway; there are many other people working on it, and I feel I can be of more use (to whomever) elsewhere.  As I read Mike's faculty page, though, a light bulb fizzled into life at the back of my brain; I was sure I'd seen that name before.  So I went searching and found what I had dimly remembered, in the form of the name of the conservative blogger, Mark Steyn. I won't go into any more detail because that's what Google's for, but here's something you definitely won't find there(*): As well as authoring with Michael Mann, I have also authored with Mark Steyn.  We were exact high school contemporaries (although only he could tell you how he went from a grammar school in Birmingham, England to worldwide fame as Canada's leading neocon blogger), and in 1973, in what would be about the eighth grade in the U.S. system, he and I collaborated on a cartoon strip for a school magazine, about a superhero called "Mini-Man".  Mark drew the pictures and I contributed some of the "humour".  One thing I remember is that Mini-Man's height was specified very precisely; it probably wasn't 2.9013 inches, but it was something rather close to that.

So yeah, it's a really small world.


(*) Until about an hour after this blog post appears, of course.

16 August 2016

Misusing science to further an agenda risks harming both

Anyone who has anything to do with science will have had a conversation with someone whose attitude can be summarised as, "Huh. Scientists. What do they know? Last year they said eating butter/smoking cigarettes/injecting heroin/playing frisbee with a lump of plutonium was bad for us, now they say it's good."

Several years ago, I would tell such people that it wasn't the scientists who were the problem; rather, it was the journalists who were distorting things to get a cool story.  Then I got a bit closer to science, and I started to ask myself some questions.  It seemed like, in many cases, the scientists were not entirely innocent.  It turned out that researchers themselves, or their institutions' press departments, will often spin a piece of research into a cute story; in some cases, I suspect that the press release is written even before the first participant is recruited.

But this particular story takes me back to the old days.  Terrible reporting of an innocent study, just to fill column inches (or, more likely these days, to provoke clicks).

The study in question is Market Signals: Evidence on the Determinants and Consequences of School Choice from a Citywide Lottery, by Steven Glazerman and Dallas Dotter.  (You can download the full article as a PDF file from the page I linked to.)  The authors examined the behaviour of parents whose children were about to enter, or change school within, the school system of Washington, DC.  Basically, not everybody can get to go to their first choice of school, so parents rank a selection of schools in descending order of preference, and then a computer tries to assign as many people as possible to a choice that is as high on their list as possible.

Parents didn't give reasons for their choice of rank ordering, but Glazerman and Dotter reasoned that it might be possible to examine their choices and see what factors were influencing them.  For example, it seems reasonable that the further a school is from your home, the less likely you are going to be to want to send your child there, all other things being equal.  On the other hand, if there's a good bus service, that might offset the distance factor, perhaps especially for older kids who can ride the bus on their own.

These kinds of studies can often provide useful information for people who are planning educational and other resources.  Indeed, Glazerman and Dotter were interested in seeing what factors actually drive parental preference for schools, as a way to help school systems plan where to put their schools, how large to make them, etc.  For example, if they were to discover that distance actually has a very small effect if there is a good bus service, that might allow planners to feel better about moving a school to a greenfield site some way removed from where people live, and provide extra buses, rather than trying to expand the school in a limited space in its current location.  It's all very wonkish, numerical stuff --- indeed, the article comes from an organisation called "Mathematica Policy Research".

Now, one of the factors that Glazerman and Dotter examined was ethnicity (or race, or whatever you want to call it).  In the study, parents and their children were categorised as "White", "African American", or "Hispanic".  (For the purposes of this post, I'll ignore awkward questions about mixed-race families, or indeed the meaning of race and ethnicity; this post isn't really about that, although of course as a white person I have my own baggage here.)  Also, data were available on the ethnic mix of the children already attending each school.  So one of the factors that the authors were able to tease out from their data was the extent to which the proportion of students of ethnicity X in a school affected the preference of parents of ethnicity X for that school.


I've taken the liberty of reproducing Table 7 from the article here (apologies to people reading this on a mobile device).  To see how the model works, look at the first section, "Convenience", and the first line within that, "Distance (miles)".  For each of three school age ranges, and for each of three ethnicities, there is a number showing the effect of distance from home to school on parents' likelihood of choosing any given school.  All of the numbers are negative, which means that the model appears to be working: A greater distance has a negative effect on your willingness to choose that school.  And as a bonus, this effect is larger for elementary school, which makes sense (to me, anyway) --- it's more important that your smaller kids' elementary school is closer to your home than their big siblings' high school.  (The actual numbers in the table are standardised, so they don't have any meaning outside the table; just remember that bigger numbers mean a stronger positive or negative preference.)

Now look at the section entitled "School Demographics".  It gets a little complicated here because the authors found that a quadratic relation between demographics and likelihood of choosing provided a slightly better fit to the data, but basically, the same rules hold: A positive number means a preference for the same ethnicity, and a larger number means a stronger preference.  The quadratic terms are not very large, so for the purposes of this post, we can look at just the first line in this section, "Own-race percentage/10". In contrast to home-to-school distance, the results for ethnicity are not very consistent.  For White parents, there is a coefficient of 0.109 (i.e., an apparent preference) for a larger number of White students in their kids' elementary school, and the stars next to this value mean that it is statistically significant, suggesting that there was little variability among parents on this measure.  On the other hand, African American parents have a statistically significant coefficient of 0.188 for their preference for seeing more students of the same ethnicity in middle school, and for Hispanic parents, the coefficient for their preference for more Hispanic kids in high school is even higher at 0.485.

These numbers don't immediately seem to make a lot of sense to me.  Maybe there are some other factor driving them.  Remember, parents didn't explicitly state "I want my kid to go to a school with lots of people who look like him/her"; this was inferred from their expressed preferences of school, and the ethnic makeup of that school.  It might be that there are other factors driving these choices that the authors didn't (or couldn't) measure, or it could be that there is a lot of noise in their model.  The article is only a "Working Paper", meaning it hasn't been published in a peer-reviewed academic journal yet.

However, here's how this was written up in Slate by Dana Goldstein: "One Reason School Segregation Persists: White parents want it that way."  I encourage you to read that piece after first reading Glazerman and Dotter's carefully-written study.  The Slate article is a collection of cherry-picked items designed to support an agenda.  Here's the cherry-picking in full:
Across race and class, a middle-school parent was 12 percent more likely to choose a school where his child’s race made up 20 percent of the study body, compared with a school with similar test scores where his child’s race made up only 10 percent of the study body. White and higher-income applicants had the strongest preferences for their children to remain in-group, while black elementary school parents were essentially “indifferent” to a school’s racial makeup, the researchers found. The findings for Hispanic elementary and middle school parents were not statistically significant.
Let's unpack that.  The first statement doesn't tell us anything about ethnic bias, other than the rather unsurprising news that parents of all races would apparently slightly prefer their kids to be in a 20% minority versus a 10% minority.  (After all, Everyone's a Little Bit Racist.) The second sentence is a masterpiece of careful drafting.  First, note "White and higher-income applicants".  Everyone knows that White people tend to have higher incomes, so this is just rhetorical double-dipping, hiding the fact that higher-income African American and Hispanic parents also had a preference for their child to "remain in-group".  That might tell us something about well-off people (perhaps a follow-up article is in the works, telling us about the evils of rich, as opposed to White, people), but it's utterly irrelevant to the claims that this phenomenon is being driven by White people's prejudices.  Second, did you spot that "black elementary school parents were essentially 'indifferent' to a school’s racial makeup"?  That's indeed what the data show.  But Goldstein chose not to tell us that African American parents were apparently very concerned about the racial makeup of middle schools.  And finally, look at the last sentence.  It's also true, but it omits the fact that the coefficient of ethnic preference for Hispanic parents of high school students was statistically significant (and large).  But the net result is clear: The scene is set for the author to tear into the barely-unconscious sins of (only) White parents.

Perspective is everything.  Back in the Cold War, there was a joke that went like this:  The American ambassador to the United Nations challenged the Soviet ambassador to a running race.  The New York Times reported the result: "U.S. ambassador beats Soviet ambassador". Pravda reported: "Soviet ambassador finishes heroic second in race; U.S. ambassador next to last". 

So, let's get some perspective here.  These parents are residents of Washington DC, a city that is 48% Black and 44% White; probably one of the most ethnically mixed cities in the United States, I'm guessing.  It's surrounded by the leafy suburbs of Maryland and northern Virginia, which, from what I've seen on tourist visits to those areas, is where a lot of White people who commute to work in DC tend to live; and they were not part of Glazerman and Dotter's study, which covered District of Columbia residents only.  Those White people who have not become part of the "white flight" to the suburbs are, I suggest, likely to be pretty tolerant of people from other ethnicities.  Indeed, Glazerman and Dotter's results suggest that the percentage of White students at which the attractiveness of ethnic similarity for a middle school peaked was just 26% (i.e., less White than the city as a whole).  This does not suggest some kind of supremacist attitude towards the fellow students of these parents' 11-14 year old children.  (My bet, for what it's worth, is that noise is the best explanation of a lot of these findings, but I'm not here to critique Glazerman and Dotter's study, which I found interesting and informative.)

This could get political, and I don't want it to.  Racism is a bad thing, and mixing ethnicities in schools seems to me to be a good idea.  But journalists with an agenda to find bad things happening ought not to cherry-pick scientific reports in which those bad things have not, in fact, been discovered.  It provides ammunition for the kind of people who use words like "libtard" on social media, and it does a disservice to those who are very likely not part of the problem.  There are any number of other sources of racial disharmony that it would be much more productive to investigate.

I asked Steve Glazerman, one of the authors of the study, for a comment on this.  He replied: "Misinterpretation is an occupational hazard that we occasionally face as researchers”.  Science, especially social science, has plenty of problems right now.  In its efforts to get away from confirmation bias, it doesn't need lazy journalism, demonstrating exactly the same bias, to create false narratives with potentially damaging consequence for public policy.

Dana Goldstein concluded her article with "Because research—and history—show that left to their own devices, parents won’t desegregate schools."  I can't comment on the "history" part of that, although I suspect that it's true, albeit complicated.  But this research says no such thing.  Falsely adopting the legitimacy conferred by "SCIENCE" is dangerous, no matter how well-meant one's agenda might be.

04 July 2016

Old stereotypes

For an assortment of reasons, I found myself reading this article one day: This Old Stereotype: The Pervasiveness and Persistence of the Elderly Stereotype by Amy J.C. Cuddy, Michael I. Norton, and Susan T. Fiske (Journal of Social Issues, 2005).

The premise was (roughly) that elderly people are stereotyped as "warmer" to the extent that they are also perceived as incompetent (as in "Grandma's adorable, but she is a bit doddery").  The authors wrote:

We might expect a competent elderly person to be seen as less warm than a reassuringly incompetent elderly person. The open question is whether this predicted loss of warmth is offset by increases in perceived competence, or whether efforts to gain competence may backfire, decreasing rated warmth without corresponding benefits in competence(*).

The experimental scenario was fairly simple.  There were 55 participants in three conditions.  In the Control condition, participants read a neutral story about an elderly man, named George.  In the High Incompetence (hereafter, just High) condition, the story had extra information suggesting George was rather forgetful.  In the Low Incompetence (hereafter, just Low) condition, by contrast, the story had extra information suggesting George had a pretty good memory for his age.   The dependent variable was a rating of how warmly participants felt towards George: whether they thought he was warm, friendly, and good-natured.  Each of those was measured on a 1-9 scale.

Here is the results section:

Let's see.  The three warmth ratings were averaged, and then a one-way ANOVA was performed.  This was statistically significant, but of course that doesn't tell us exactly where the differences are coming from.  You might expect to see this investigated with standard ANOVA post-hoc tests (such as Tukey's HSD), but in this case, the authors apparently chose to report simple t tests --- "Paired comparisons" (**) --- comparing the groups.  Between High and Low, the t value was reported as 5.03, and between High and Control, it was 11.14.  These values are always going to be statistically significant; for 5.03 with 35 dfs this is a p of around .00001 and for 11.14 with 34 dfs, the p value is bordering on the homeopathic, certainly far below .00000001.

Hold on a minute.  The overall 3x1 ANOVA was just about significant at p < .03, but two of the three possible t tests were slam-dunk certainties?  That doesn't feel right.

Let's plug those means and SDs into a t test calculator.  There are several available online (e.g., this one), or you can build your own in a few seconds with Excel: put the means in A1 and B1, the Ns in C1 and D1, the SDs in E1 and F1, and then put this formula in G1:
  =(A1-B1)/SQRT((E1*E1/C1)+(F1*F1/D1))
(That just gives you the Student's t statistic; adding p values is left as an exercise for the reader, as is the extension to Welch's t test.)

Before we can run our t test, though, we need the sizes of each sample.  We know that nHigh + nLow + nControl equals 55.  Also, the t test for High/Low had 35 dfs, meaning nHigh + nLow equals 37, and the t test for High/Control had 34 dfs, meaning nHigh + nControl equals 36.  Putting those together gives us 18 for nHigh, 19 for nLow, and 18 for nControl.

OK, now we can do our calculations.  Here's what we get:
High/Low: t(35) = 1.7961, p = .0811
High/Control: t(34) = 3.2874, p = .0024
Low/Control: t(35) = 0.7185, p = .4772 (just for completeness)

So there is no statistically significant difference between the High and Low conditions.  And, while the High/Control comparison is significant, its strength is far less than what was reported. If you ran this experiment, you might conclude that the intervention was maybe doing something, but it's not clear what.  Certainly, the authors' conclusions seem to need substantial revision.

But wait... there's more.  (Alert readers will recognise some of the ideas in what follows from our GRIM preprint).

Remember our sample sizes: nHigh = 18, nLow = 19, nControl = 18.  And the measure of warmth was the means of three items on a 1-9 scale.  So the possible total warmth scores across the 18 or 19 participants, when you add up the three-item means, were (18.000, 18.333, 18.666, ..., 161.666, 162.000) for High and Control, and (18.000, 18.333, 18.666, ..., 170.666, 171.000) for Low.

Now, the mean of the High scores was reported as 7.47.  Multiply that by 18 and you get 134.46.  Of course, 7.47 was probably rounded, so we need to look at what it could have been rounded from.  The candidate total scores either side of 134.46 are 134.333 and 134.666.  But when you divide 134.333 (recurring) by 18, you get 7.46296, which rounds (and truncates) to 7.46, not 7.47.  And when you divide 134.666 (recurring) by 18, you get 7.48148, which rounds (and truncates) to 7.48, not 7.47.

Let's look at the Low scores.  The mean was reported as 6.85.  Multiply that by 19 and you get 130.15.  Candidate total scores in that range are 130.000 and 130.333.  But when you divide 130.000 by 19, you get 6.84211, which rounds (and truncates) to 6.84, not 6.85.  And when you divide 130.333 (recurring) by 19, you get 6.85956, which rounds to 6.86.  (It could be truncated to 6.85 if you really weren't paying attention, I suppose.)

For completeness, the Control mean of 6.59 is possible: 6.59 times 18 is 118.62, and 118.666 divided by 18 is 6.59259, which rounds and truncates to 6.59.

So this means that, given the dfs as they are reported in Cuddy et al.'s article, the two means corresponding to the experimentally manipulated conditions are necessarily incorrect.

A possible solution that allows the means to work is if the dfs of the second t test were misreported.  If you change t(35) to t(34), that implies nHigh = 19, nLow = 18, nControl = 18, and now the means can be computed correctly.  But one way or another, there's yet more uncertainty here.

To summarise, either:
/a/ Both of the t statistics, both of the p values, and one of the dfs in the sentence about paired comparisons is wrong;
or
/b/ "only" the t statistics and p values in that sentence are wrong, and the means on which they are based are wrong.

And yet, the sentence about paired comparisons is pretty much the only evidence for the authors' purported effect.  Try removing that sentence from the Results section and see if you're impressed by their findings, especially if you know that the means that went into the first ANOVA are possibly wrong too.

As of today, Cuddy et al.'s article has 523 citations, according to Google Scholar; yet, presumably, none of the people citing it, nor indeed the reviewers, can have actually read it very carefully.  So I guess some of the old stereotypes are true, at least when it comes to what people say about social psychology.

(*) Note that the study design arguably did not really test any efforts by the elderly person to gain competence; it tested how participants reacted to descriptions of the person's competence by a third party, which is not quite the same thing.

(**) I presume that the term "paired comparisons" refers to the fact that the comparison was between a pair of groups in each case, e.g., High/Low or High/Control.  The authors can't have performed a paired samples t test, since the samples were independent.

[Update 2016-07-04 13:32 UTC: Thanks to Simon Columbus for his comment, pointing out the PubPeer thread on this article.  Apparently a correction has been drafted (or maybe published already?) that fixed the t values, and then claims, utterly bizarrely, that this does not change the conclusion of the paper.  But even if we accept that for a nanosecond, it does not address the question of why the means were not correctly reported.  It looks like a second correction may be in order.  I wonder what Lady Bracknell would say?]

[Update 2016-07-09 22:17 UTC: Fixed an error; see comment by John Bullock.]