In my previous blog post I mentioned that the next one, which you are reading now, would look at a recent paper from Nicolas Guéguen that I investigated using a technique that James Heathers and I (mostly me, this time) developed, which we call RIVETS.
The article
On 2024-09-06 I was able to download the PDF file from here. (Amusingly, one of the first things that I noticed is that it cites an article from the late Cornell Food and Brand Lab.)
Judging from the appearance of its articles and its website, the journal appears to be from the same stable as the European Journal of Public Health Studies, which published the paper that I discussed last time. So, again, not a top-tier outlet, but as ever, it's what's in the paper that counts.
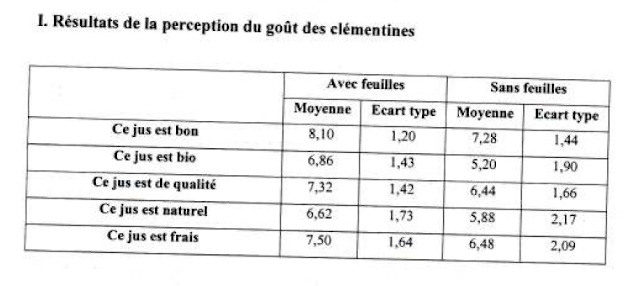
The subject matter of the article is, as is fairly typical for Guéguen, not especially challenging from a theoretical point of view. 100 participants were assigned to drink a plastic cup of clementine juice while seated at a table with some clementines on it, and then rate the juice on five measures. There were two conditions: In one condition the clementines were just naked fruit, and in the other they still had some leaves attached to them. There were 50 participants in each condition.
Let's have a look at the results. Here is Table 1:

Four of the results attain a conventional level of statistical significance and one doesn't.
Introducing RIVETS
The next thing I check for is whether the test statistics match the descriptives. There are a couple of ways to do this. These days I generally use some code that I wrote in R, because that lets me build a reproducible script, but you can also reproduce the results of this article using an online calculator for t tests (remember, F = t²) or F tests. Whichever you choose, by putting in the means and SDs, plus group sizes of 50, you should get these results:

You can see that in three of the five cases, the calculated F statistic exactly matches the reported one to 2 decimal places. And in fact when I first did the calculations by hand, I erroneously thought that the published value of the first statistic (for Goodness) was 9.41, and so thought that four out of the five were exact matches.
Why does this matter? Well, because as James and I describe in our RIVETS preprint, it's actually not especially likely that when you recalculate test statistics using rounded descriptives you will get exactly the same test statistic to 2dp. In this case, for the three statistics that do match exactly, my simulations show that this will occur with 5.24%, 10.70%, and 6.73% of possible combinations of rounded input variables, respectively.
Had those been the only three test statistics, we would have a combined probability of all three matching of 0.0003773, which — assuming that the numbers are independent — you can treat roughly as a p value. In other words, it's not very likely that those numbers would appear if they had been produced with real data. And we can go further: If (again, this is not the case) the first two F statistics had been reported as 9.41 and 23.11, the percentages for those in the simulation are 3.93% and 3.00%, so the combined probability of all five matching would be 4.449e-7, which is very unlikely indeed.
But, as we wrote in the RIVETS preprint, the analyst has to be principled in its application. Two of the five reported test statistics were not what we might call "RIVETS-perfect", which seems like quite strong evidence that those numbers were generated from real data (unless, perhaps, the authors took RIVETS into account, in which case, they should take a bow). At this point the forensic analyst has to grimace a bit and go and get a cup of coffee. This line of investigation (i.e., the hypothesis that the authors had no data and merely made up the summary statistics) is probably a dead end.
Another blast from the past

Well, back in 2016, when the French Psychological Society (SFP) was trying to investigate Guéguen's prolific output of highly implausible studies, he sent them a huge bunch of coursework assignment papers produced by his students, which the SFP forwarded to me. (Briefly: Guéguen teaches introductory statistics, mainly to undergraduates who are majoring in business or economics, and sends his students out in groups of 3 or 4 to collect data to analyse with simple methods, which they often end up faking because doing fieldwork is hard. See this 2019 post for more details on this.)

The above table is taken from one such student assignment report. The analysis is hilarious because the students seem to have fallen asleep during their teacher's presentation of the independent-samples t test and decided that they were going to treat a difference of 0.5 in the means as significant regardless of the standard deviation or sample size. (I guess we could call this the "students' t test", ha ha.)

Now, for some reason this particular paper out of the 25 must have stood out for me, because even though the analysis method used is hot garbage, back in October of 2016 I had actually tried to reproduce the means and SDs to try to understand the GRIM and GRIMMER inconsistencies. To their great credit, the students included their entire dataset — every observation of every variable — in their report, and it was not difficult to type these numbers into Excel. Here are the last few lines of that spreadsheet. (The first and seventh columns, with all 1s and 0s, are the conditions.)

Compare those means and SDs with the table in the published article. You will see that all 20 values are identical. I'm not sure how the students managed to get so many of their means and SDs wrong. The data in the report are presented in the form of a table that seems to be in a computer file (as opposed to handwritten), but maybe they didn't know how to use Excel to calculate the means and SDs, and attempted to do it manually instead.
Item	F statistic
Bon	9.44
Bio	23.14
Qualité	7.46
Naturel	2.98
Frais 6.63Comparing the students' report with the published article
- The article states that participants were "welcomed by a research assistant and invited to enter a room". In contrast, the students' report states that the experiment was conducted directly in the hall of the Lorient University Institute of Technology, where they recruited participants by intercepting people as they passed by and invited them to come to a table, with no mention of a separate room.
- The article reports that the clementine juice was served at a temperature of 6°C. The students' report does not discuss the temperature, and it does not seem that the students took any particular precautions to serve the juice at a controlled temperature. The photographs show the juice in a clear plastic or glass bottle that does not appear to have any sort of thermal insulation, nor does it seem likely that a refrigerator would be available in the hall (or that the students would have failed to mention this degree of investment in maintaining a constant temperature if they had made it).
- The article mentions that participants were debriefed and asked if they thought they knew what the purpose of the experiment was. Nothing of this kind is mentioned in the students' report.
- The article says that the participants were "100 Caucasian undergraduate science students at the University of Bretagne-Sud in France". It does not mention their sex breakdown or age range. The students' report states merely that participants were people who were encountered at the Lorient University Institute of Technology (which is indeed a part of the University of Bretagne-Sud), with an unknown academic status, overwhelmingly male, and with an age range of approximately 17 to 60, which suggests that at least some were not undergraduates. Additionally, the students did not report the race of the participants, which would in itself be an extremely unusual data point to collect in France. Anecdotally, it is quite likely that several of them would not be "Caucasian" (a totally meaningless term in French research circles).
Why are the students not credited?
Conclusion
Supporting information
Footnotes
‡ The number and gender of the students is revealed in the report, either explicitly (for the number) or implicitly (for the gender, by the fact that all of the adjectives that describe the students are in the feminine form, which in French implies that everyone in the group to which the adjective refers was female).
